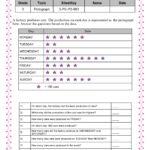
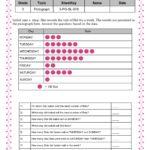
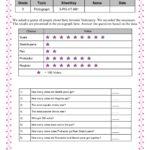
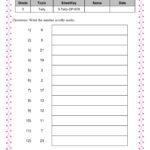
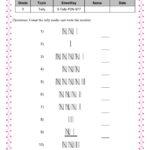
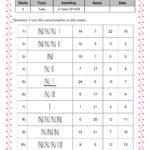
Handling data and working with pictographs of different types of data.
Product Page
Graphs Worksheets For Grade 3
Graphs are basic but very powerful data science. Graphs are pictorial representations of data in an organized manner. In class 3, students will be able to understand and depict information given in the data in a visual illustration. After solving these graphs worksheets for grade 3, the students will be able to create graphs, infer data from graphs, create, and use tally marks.
📚 Upgrade to the Grade 3 Maths Workbook Series
Avoid printing loose sheets individually. Choose a structured approach tailored to your child's exact academic goals:
Comprehensive Workbooks: Covers the entire syllabus sequentially with 2 worksheets per topic. Ideal for full-term revision.
Chapter-Wise Workbooks: Deep-dives covering specific chapters with ~5 worksheets per sub-topic for concept mastery.
Workbook Bundles: Get the complete collection of all chapter workbooks grouped together in 1-click for maximum value.